
Why That Green Blob on Your Live Weather Radar Map Might Not Mean Rain at All

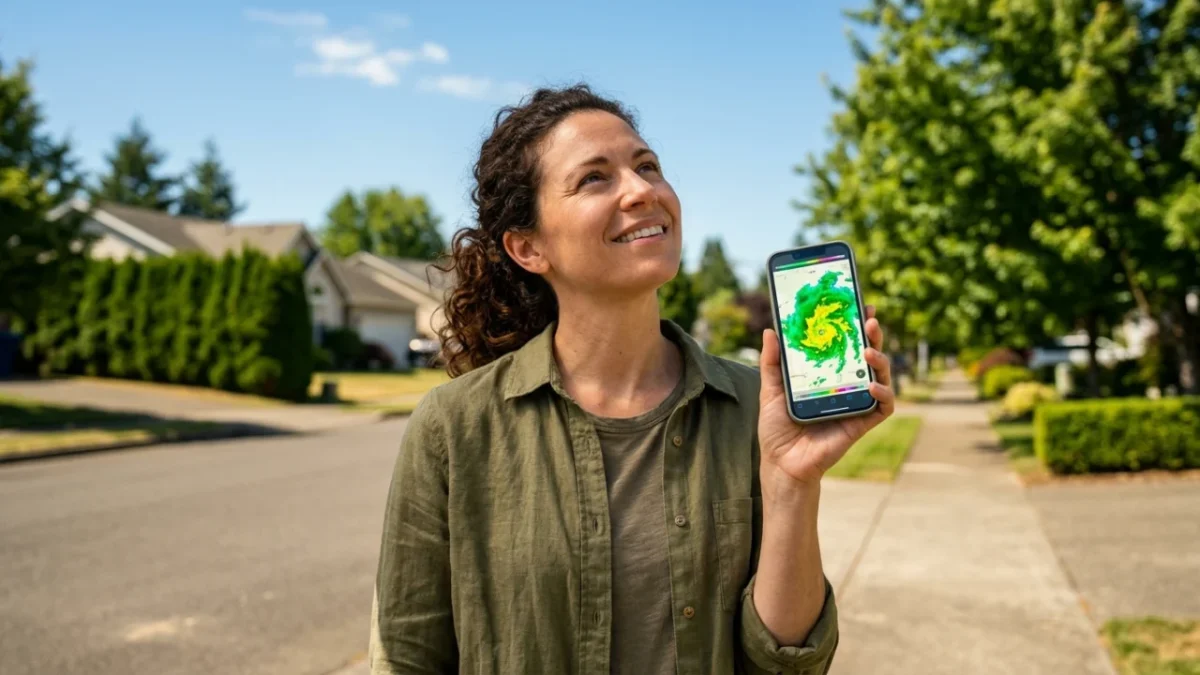
A bright green streak covering your neighborhood on a live weather radar does not guarantee a single drop of rain will hit your pavement. What you are viewing on your smartphone screen is atmospheric reflectivity, measuring energy bouncing off water droplets thousands of feet in the air, not ground-level precipitation.
Every time storm clouds roll in, millions of mobile users open interactive tracking maps expecting an instantaneous, pinpoint prediction. Yet misinterpreting these scans causes needless panic or leaves people completely unprepared for sudden downpours.
Understanding how radar pulses track atmospheric shifts turns a confusing swirl of bright colors into actionable, lifesaving intelligence.
How a Live Weather Radar Map Actually Detects Precipitation
Modern weather monitoring relies heavily on ground-based Doppler radar installations. These spherical domes emit focused pulses of radio waves into the atmosphere at rotating angles, measuring both the energy bounced back and the speed of moving particles.
When the transmitted electromagnetic pulse strikes an airborne object—such as a raindrop, hailstone, snowflake, or insect swarm—a fraction of that energy bounces back to the radar antenna. The system calculates the delay to establish distance and analyzes the returning signal’s power to assess particle density.
Base reflectivity measures the raw intensity of returning echoes at a single scanning angle, usually the lowest tilt of roughly 0.5 degrees. Composite reflectivity, by contrast, combines the maximum echo intensities across all vertical scan angles, revealing the heaviest core of a storm aloft even if it has not yet touched the ground.
Radar maps do not display rainfall falling on your head; they display precipitation particles intercepted by an ascending beam miles away from the ground station.
Base Reflectivity vs. Composite Reflectivity
Knowing which display layer your mobile mapping tool uses is critical during severe weather tracking.
| Radar Display Mode | Practical Function |
|---|---|
| Base Reflectivity | Scans closest to the terrain to reveal active precipitation nearing the ground. |
| Composite Reflectivity | Aggregates all elevation tilts to reveal severe storm structure and hail cores aloft. |
| Doppler Velocity | Tracks wind direction and speed toward or away from the radar dish to spot rotation. |
| Dual-Polarization | Distinguishes hydrometeors (rain, ice, snow) from non-meteorological airborne debris. |
Why Radar Signals Can Be Deceptive
One common misconception is assuming every bright reflection signifies torrential rain. In dry lower atmospheres, precipitation frequently evaporates entirely before reaching ground level—a meteorological phenomenon known as virga.
Your screen may show solid yellows or greens directly overhead, yet your lawn stays completely dry because dry ambient surface air swallows the descending moisture before contact. Dual-polarization radar upgrades help address this issue by sending out both horizontal and vertical pulses, allowing computers to gauge particle shape and consistency.
Three Steps to Read a Storm Forecast Accurately
To avoid misreading your screen during shifting conditions, follow this structured routine:
- Check the timestamp: Ensure the interactive loop shows actual scans rather than delayed cache files or forward-projected computer simulations.
- Toggle between scan modes: Compare the lowest-elevation scan against composite views to confirm whether rain cores are descending.
- Examine the motion loop: Track the movement direction across multiple past frames rather than relying on a single static image.
Ground clutter, biological targets like migratory bird flocks, and atmospheric beam bending can also generate phantom precipitation signatures on clear days.
Learning these technical nuances ensures you make informed decisions when hazardous cells develop along your route.
📱 How often do you check interactive storm maps during your weekly commute?
✨ Sharing this guide with friends helps everyone interpret severe storm warnings with total clarity.
👇 Drop your thoughts in the comments below and share which weather tracking tools you trust most.
 1
 2
 3
 4
